- Published on
Distributed request tracing in AWS with Serverless Node.js
- Authors

- Name
- James Bourne
Diagnosing failures in even the simplest of distributed systems can be a source of some serious headaches. Having the incorrect information due to human error can lead you to incorrect conclusions about the cause of a problem.
A good tracing tool should tell you a few things at minimum:
- Request metadata (HTTP method, URL, headers, etc.)
- Timing information
- Failure rates
- The nodes/services involved in serving a request
Request tracing is usually the first tool I will reach for when diagnosing an issue. It provides me with an overview of a complex system and helps identify areas to target with more in-depth analysis if they show unusual characteristics such as an elevated error rate, high latency, or some combination of the both.
Getting started
We'll start off by creating a new application using Serverless.
serverless create --template aws-nodejs-typescript
Install dependencies in node_modules:
npm install
And then deploy to AWS (make sure you have AWS credentials configured):
serverless deploy
After a few minutes, we should have a new CloudFormation stack, and should see a summary of the deployment:
Service Information
service: request-tracing
stage: dev
region: us-east-1
stack: request-tracing-dev
resources: 11
api keys:
  None
endpoints:
  GET - https://86f8o218gg.execute-api.us-east-1.amazonaws.com/dev/hello
functions:
  hello: request-tracing-dev-hello
layers:
  None
We can test out our new endpoint with a quick curl request:
curl https://86f8o218gg.execute-api.us-east-1.amazonaws.com/dev/hello -s \
  | jq '.message'
"Go Serverless Webpack (Typescript) v1.0! Your function executed successfully!"
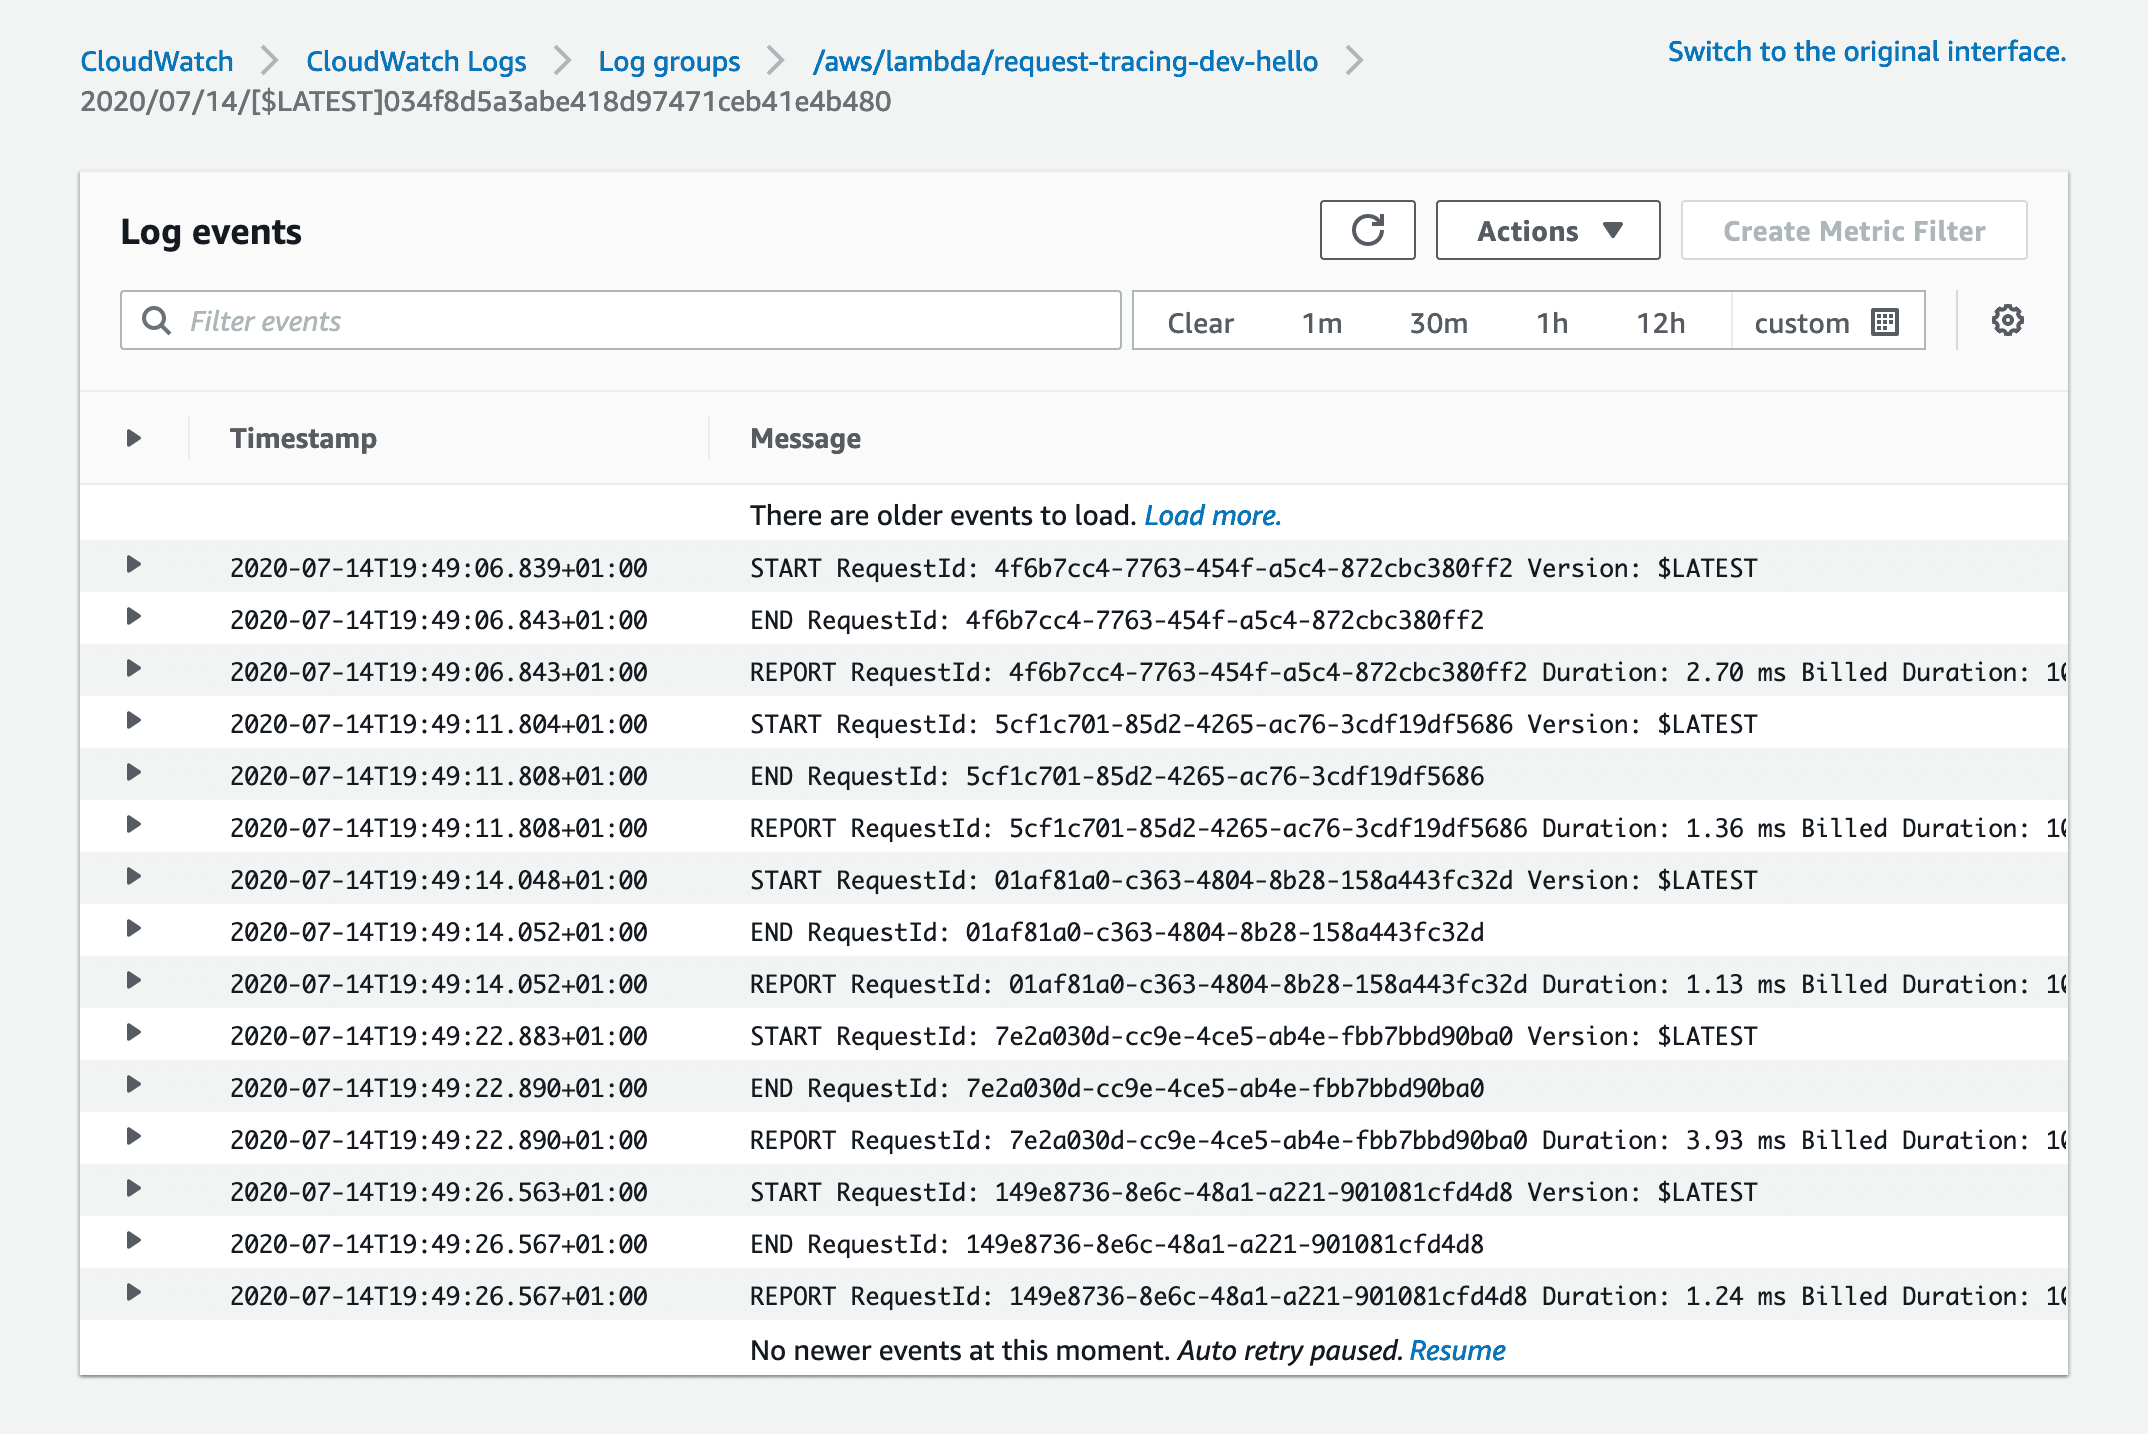
If we go to CloudWatch logs on the AWS console, we can now see some basic information in the /aws/lambda/request-tracing-dev-hello log group.
X-Ray basics
We have now deployed our Serverless stack to AWS, but have no visibility of how the service is operating! Let's fix that.
To enable X-Ray, we can update our serverless.yml to add the tracing config to the provider section:
# serverless.yml
provider:
  tracing:
    apiGateway: true
    lambda: true
We can now re-deploy the stack with another serverless deploy. If we run another curl request to our endpoint with the -v to show response headers, we can see
curl https://86f8o218gg.execute-api.us-east-1.amazonaws.com/dev/hello -s -v \
  | jq '.message'
# lots of other headers...
< x-amzn-trace-id: Root=1-5f0e00fe-81ffbb84330d1339e513148e
If we hop over to the CloudWatch ServiceLens console, we can search for our trace ID (1-5f0e00fe-81ffbb84330d1339e513148e in this example):
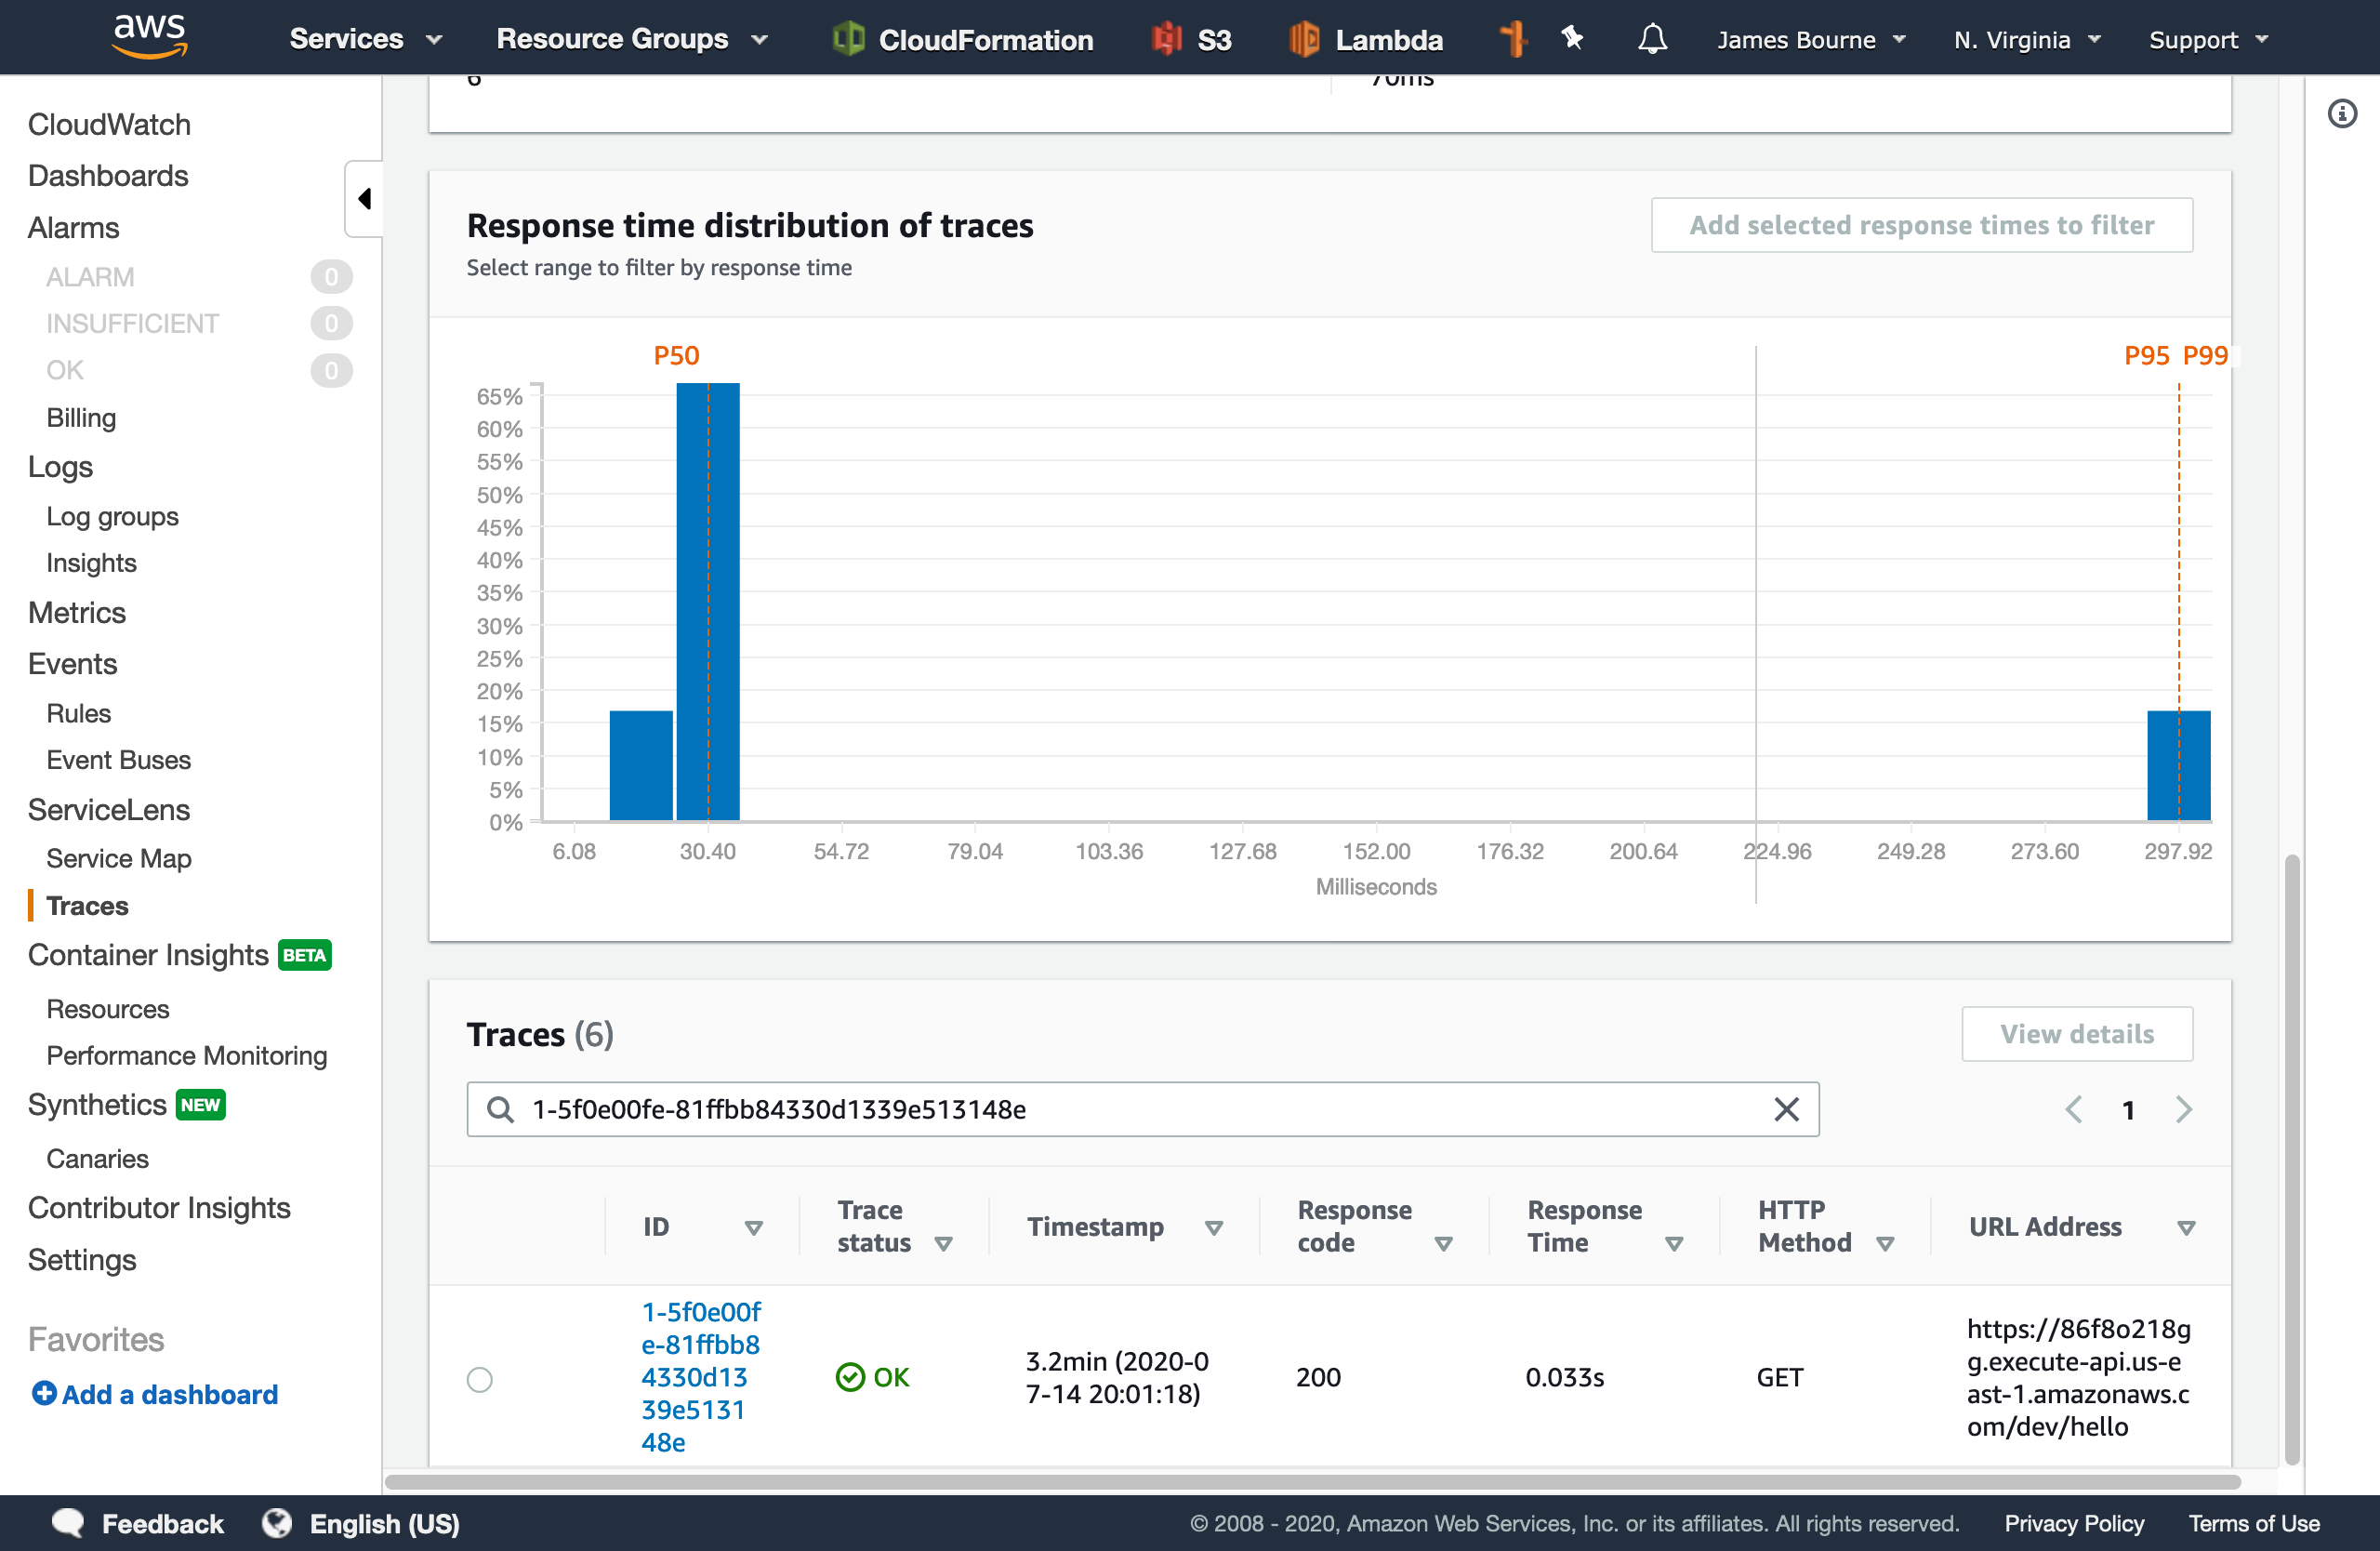
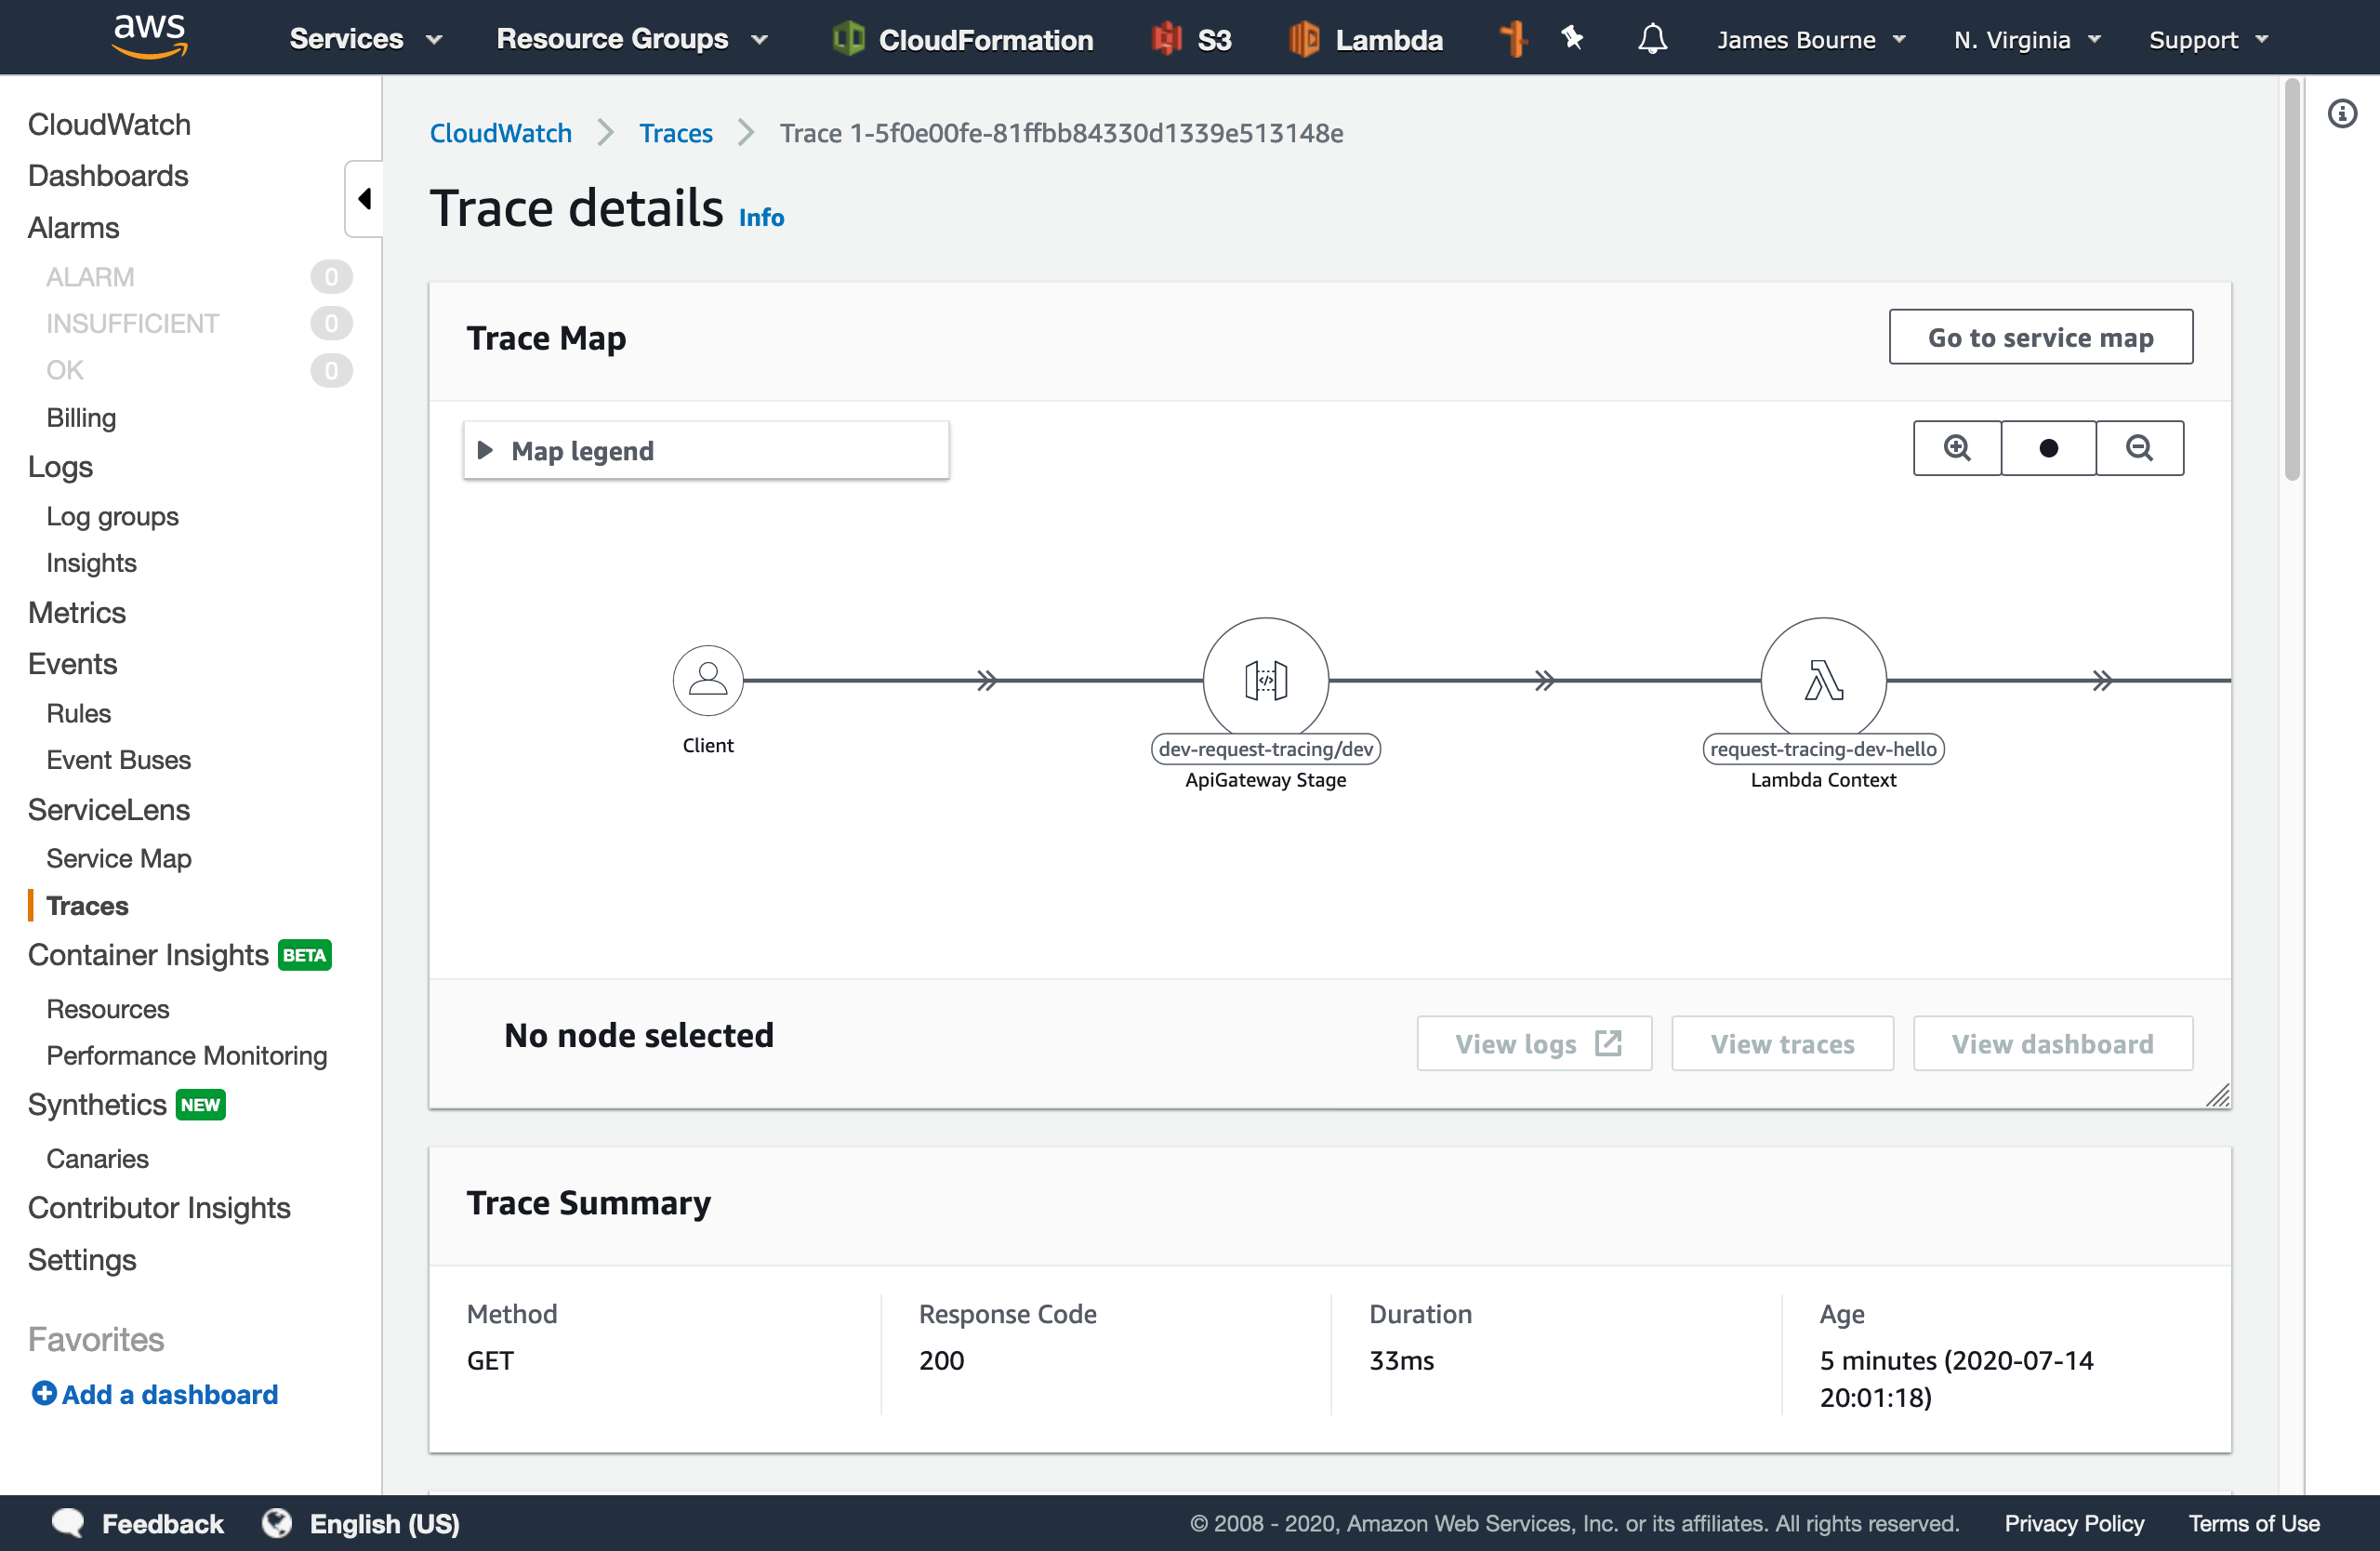
We can see an overview of the URL, response code, and some timing information. If we go to the details page, we can see a map of the services that were invoked during the request. This can be really helpful in diagnosing where a request has failed in systems that consist of many moving parts at a glance.
But wait, if we scroll down to the logs section, we can't see any!
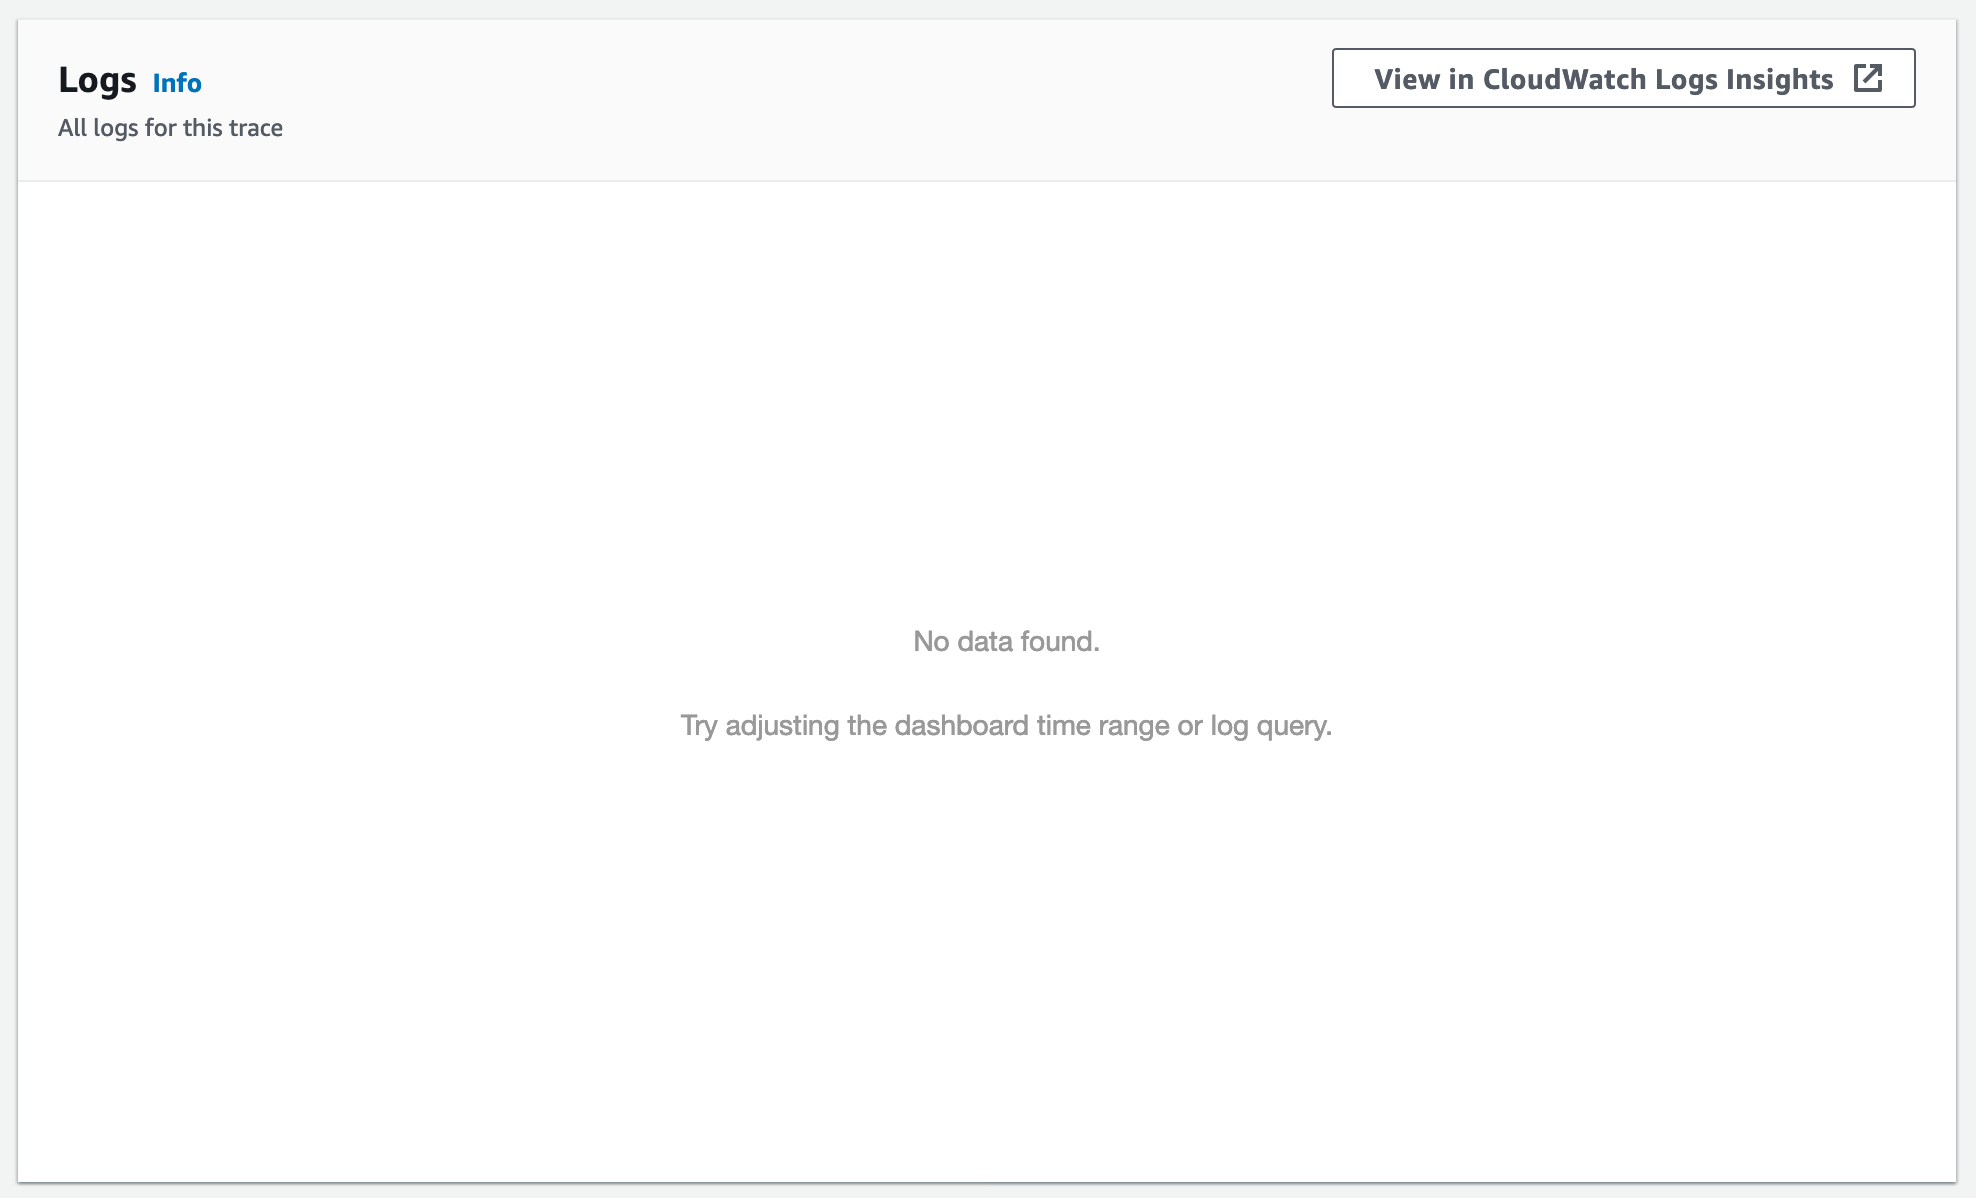
There seems to be a limitation of ServiceLens that it expects API Gateway execution logging to be enabled. No problem! We can change our serverless.yml to enable this by setting provider.logs.restApi to true:
provider:
  tracing:
    apiGateway: true
    lambda: true
  logs:
    restApi: true
If we re-deploy the application and send another request, and take a look at the trace details, we now get the expected output:
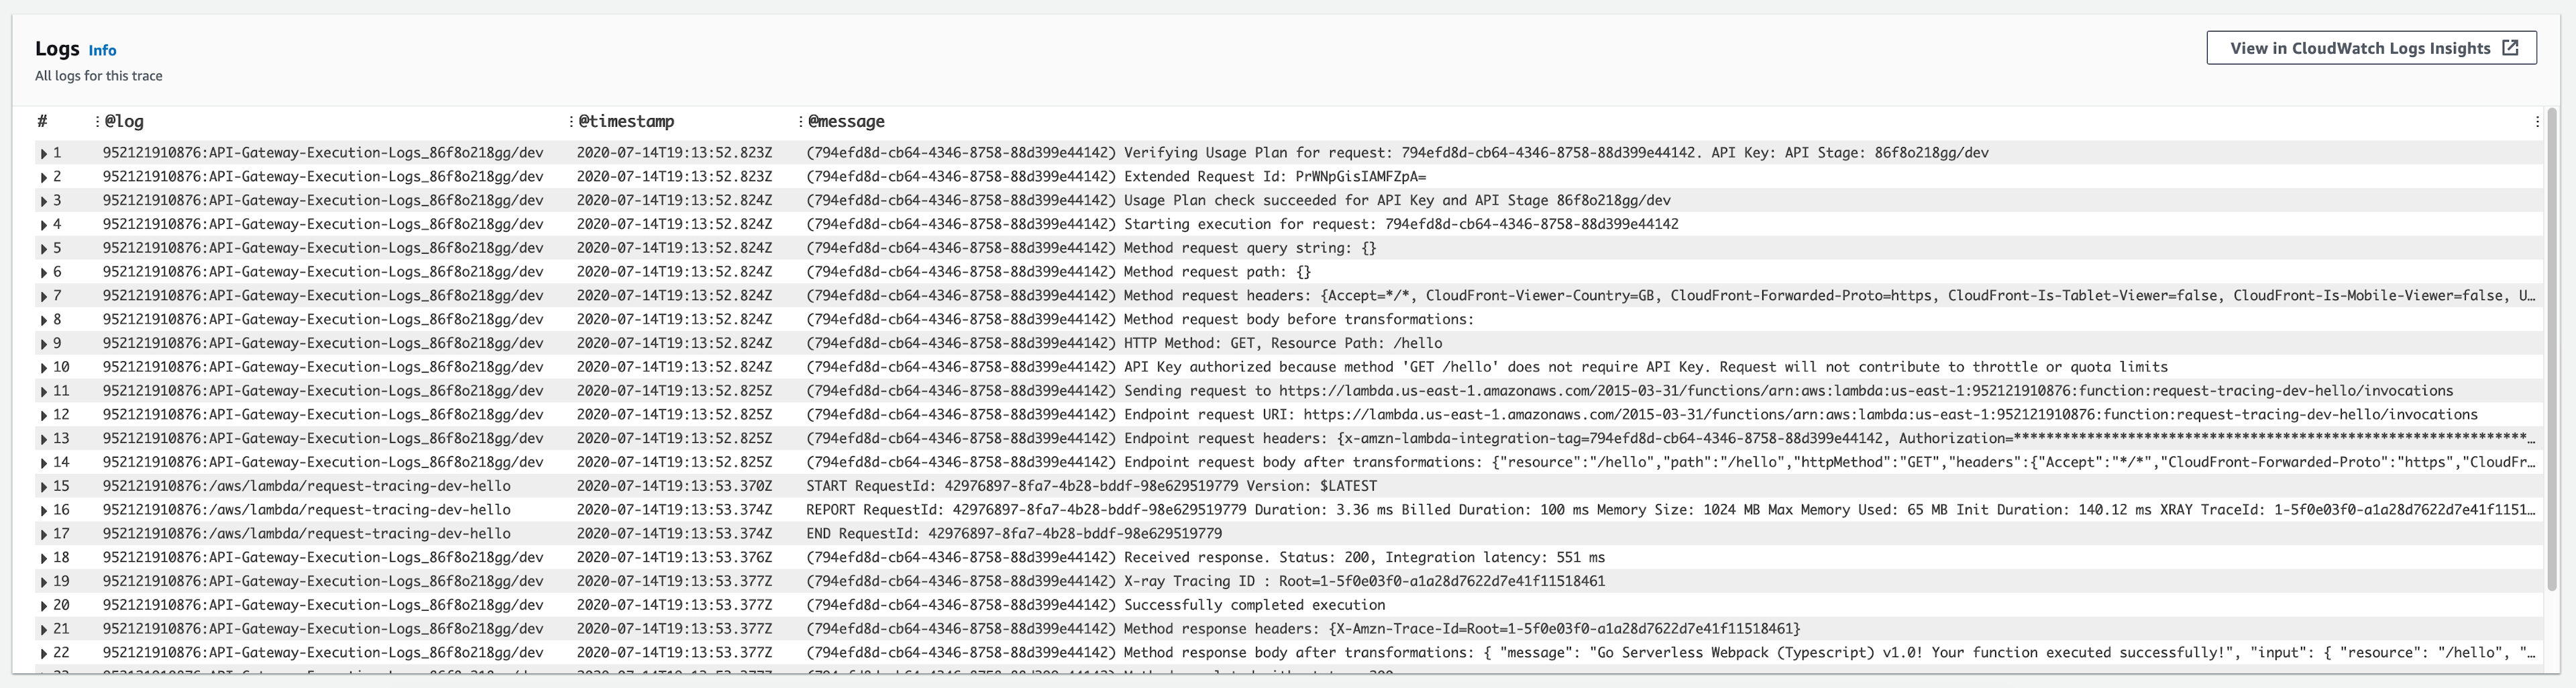
We can see in the @log field that these logs are being aggregated from both API Gateway and Lambda. We'll keep this example similar, but you can imagine how valuable this is when multiple services are involved in handling a single request.
Bring on the logs 🌲

I will be using the pino library to output structured JSON logs from our application. The output stream is not "true" JSON as we have multiple root elements but instead NDJSON - Newline delimited JSON.
Let's install the library with npm i --save pino and the TypeScript definitions with npm i --save-dev @types/pino.
We can then import the logger and update our handler function to create a logger and output some messages:
import { APIGatewayProxyHandler } from 'aws-lambda'
import 'source-map-support/register'
import * as pino from 'pino'

export const hello: APIGatewayProxyHandler = async (_event, _context) => {
  const logger = pino()

  logger.info('This is a log message from Pino!')

  logger.warn('Just a warning...')

  return {
    statusCode: 200,
    body: JSON.stringify(
      {
        message: 'Go Serverless Webpack (Typescript) v1.0! Your function executed successfully!',
      },
      null,
      2
    ),
  }
}
If we check our logs, we now have some NDJSON logs (formatted for readability):
{
  "level": 30,
  "time": 1594759998101,
  "pid": 8,
  "hostname": "169.254.47.37",
  "msg": "This is a log message from Pino!"
}
{
  "level": 40,
  "time": 1594759998102,
  "pid": 8,
  "hostname": "169.254.47.37",
  "msg": "Just a warning..."
}
The explicit key/value pairs found in structured logs allow for the logs to be queried using tools such as jq, or pino-pretty which aims to make the logs easier to scan by emphasising the log level and message while still showing any extra metadata.
The level property in our logs is equivalent to the traditional ERROR, INFO, etc. but allows for easier filtering of logs by severity using simple numeric inequalities.
We can fetch these logs using awslogs and then pipe them into pino-pretty with:
awslogs get /aws/lambda/request-tracing-dev-hello --watch --no-group --no-stream | pino-pretty
This gives a nicely formatted log stream which is easy to scan for various levels using the colour-coded log levels:

Bringing it all together
Now we have X-Ray tracing enabled, an we can output structured log messages with Pino. Right now, CloudWatch ServiceLens won't be able to associate our new log messages with the trace, as there is no reference to the IDs it uses for correlation.
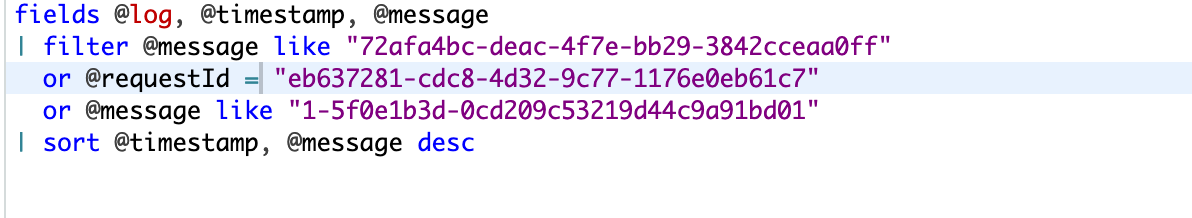
If we have a look at the query in Log Insights, we can see it is trying to match a few different request IDs and trace IDs against the log message:
We can try injecting the requestId into the log context:
logger.info({ requestId: context.awsRequestId }, 'This is a log message from Pino!')
Unfortunately AWS will not detect this, as the @requestId field is a reserved one, and attempting to log it with a key of @requestId causes it to be detected as @@requestId in Log Insights. Looks like we'll need a different approach!
AWS will automatically attach the request ID to any messages written with console.log, but not those using stdout as the default Pino implementation does.
We can pass a custom destination stream when we instantiate our logger (based on this GitHub comment):
const logger = pino(
  {},
  {
    write(buffer: any, cb?: (err?: Error | null) => void) {
      console.log(buffer)
      if (cb) {
        cb(null)
      }
      return true
    },
  }
)
We now get Pino log messages which include the request ID:
2020-07-14T21:40:24.729Z 80c5d719-e222-475f-bd32-430002b8c79c INFO {"level":30,"time":1594762824728,"pid":8,"hostname":"169.254.137.93","msg":"This is a log message from Pino, using console.log!"}
But now if we try and format our messages with pretty-pino, it won't work because of the extra metadata at the start of the log line.
The fix is quite simple - we can get Pino to output a newline \n at the start of our messages:
console.log('\n' + buffer)
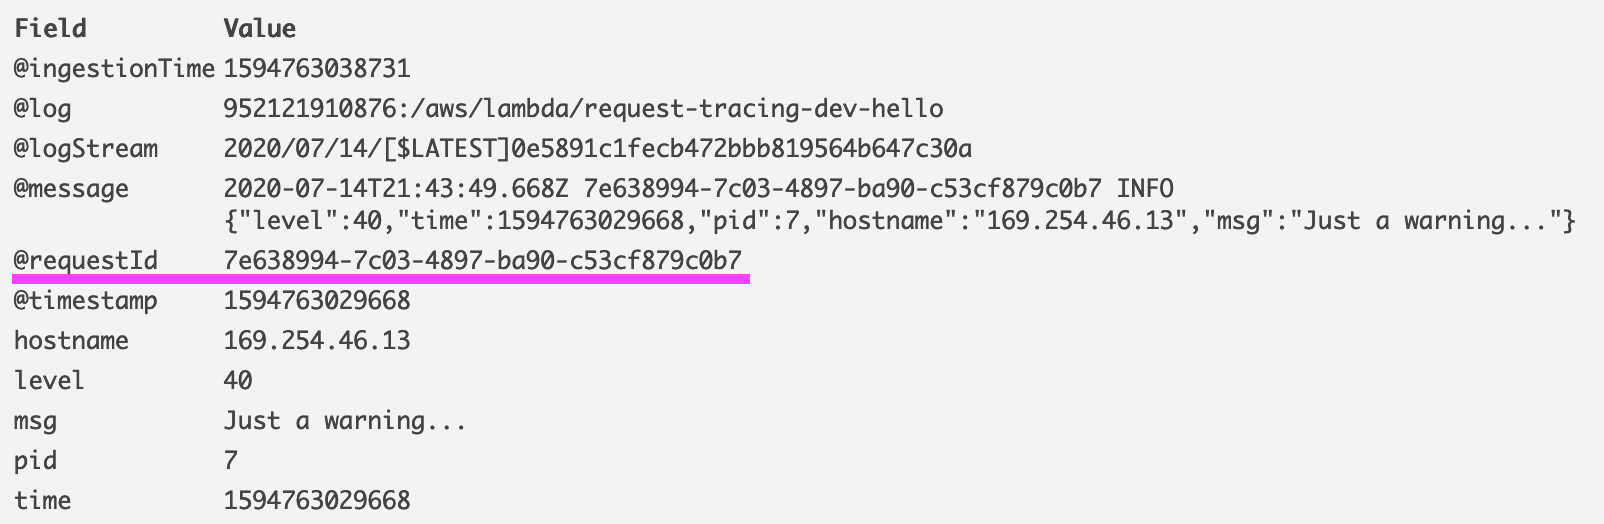
This means AWS can now detect the @requestId field for our log message:
And pino-pretty can still parse and format them:

We've now got the best of both worlds - we can correlate our logs for a single request in CloudWatch, and easily read our structured logs with Pino!
Summary
We've deployed a Serverless application and set up request tracing and structured logging - two best-practices which form a small part of building and operating distributed systems. We've seen how CloudWatch can provide valuable information to help in diagnosing issues in your application, without the overhead of managing external monitoring infrastructure.
I hope you find this useful and can apply these techniques to your own applications in order to simplify troubleshooting.
The Serverless application referenced in this post can be found on my GitHub at jamesmbourne/request-tracing.